


National home values are down 5.2 per cent from their peak, but home sales fell 17.4 per cent in a single quarter. Why transaction volumes say more than prices, where the missing sales show up in the economy and the Victorian budget, and what a thin market means if you are buying.
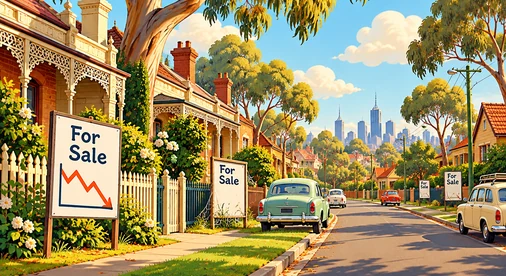
Home values are down 5.2 per cent from their peak. Home sales fell 17.4 per cent in a single quarter. The second number is the one I watch.
Everyone wants to know how far prices will fall. Since the Reserve Bank's latest rate rise, it has become the only housing question anyone asks.
It is the wrong place to look first. Economics trains you to watch quantities before prices, because quantities move earlier and say more about what people are doing. In housing, the quantity is the number of homes changing hands. That number has dropped hard.
Cotality has national home values down 5.2 per cent from peak to the end of September. Set against the growth of the past few years, that is a mild correction so far.
Sales are another matter. National volumes fell 17.4 per cent in the three months to September compared with the three months before. Brisbane is down 26.3 per cent, Sydney 24.8 per cent and Perth 23.9 per cent. Melbourne is down 18.4 per cent.
Close to one in five Melbourne transactions gone in a quarter. Prices have barely started to describe that.
Housing does not behave like shares. When shares get cheaper, bargain hunters arrive. When homes get cheaper, most people step back. Owners decide not to sell. Buyers decide to wait. The only ones who transact are the ones who have to.
Behavioural economics has a name for the seller's side of this: loss aversion. A loss hurts more than a gain of the same size pleases. Owners anchor to the best price they ever heard for their street, usually the one a neighbour achieved at the top. Selling below that number feels like a loss, even when they are still far ahead of what they paid. So they wait, and the listing never appears.
Stamp duty makes the waiting easier. Moving house is expensive, so any move that is optional gets postponed.
This is why a housing correction shows up in volumes before it shows up in prices. The index looks orderly because the owners who would have accepted less have left the market. What remains is a smaller sample, and a less representative one.
A home sale is never one transaction. It sets off a chain of spending: the conveyancer, the building and pest inspector, the photographer, the removalist, the cleaner. Then come the painter, the gardener, the electrician and the carpenter. Then the new lounge and the new fridge.
Take away one sale in five and all of that work goes with it.
The sharemarket has noticed. Two of the large listed furniture and electrical retailers have lost more than 40 per cent of their value since the start of the year. A third is down 27 per cent. Investors treat housing turnover as a lead indicator for those businesses, and they have priced in a good share of the pain already.
There is a second channel. Households that feel less wealthy spend less, including the ones who never planned to sell.
State governments are among the biggest losers. Stamp duty is collected on price multiplied by volume, so it falls twice. Land tax follows, more slowly.
Victoria's own budget papers put a number on it. A 10 per cent fall in prices combined with a 10 per cent fall in transactions in 2026-27 would cost the state about $3.4 billion in revenue. The equivalent figure for New South Wales is $2.2 billion.
One bank's modelling runs a similar scenario nationally (stamp duty down 20 per cent this financial year, then a slow recovery over the following three) and arrives at a hit to state revenues of up to $30 billion across the forward estimates. Rising bond yields could add as much as $12 billion in interest payments on top.
Those scenarios assume transactions fall 10 per cent over the year. Melbourne lost 18.4 per cent in one quarter. A quarter is not a year, but the direction is hard to miss.
This is shaping up as the largest house price correction since the 1980s. Some forecasters now have the peak-to-trough fall reaching 13 per cent.
I think the length matters more than the depth. Inflation is sticky and growth has held up, which means the economic slowdown will take longer than usual to arrive, and the rate cuts that follow it will take longer again.
Time is what breaks the standoff. An owner anchored to a peak price can sit out a quarter or two. Fewer can sit out a long stretch of high rates. As more owners move from wanting to sell to needing to sell, prices probably start to catch up with what volumes are already saying.
A thin market cuts in two directions. You face fewer competing buyers. You also have fewer homes to choose from.
The homes that do come to market lean toward owners who have to sell. Owners with a choice hold the better properties back, or sell them quietly without a campaign. A search limited to the portals sees a narrower slice of the market than it did a year ago.
The evidence is thinner too. With fewer sales, each comparable carries more weight and goes stale faster. A national figure of 5.2 per cent tells you very little about one street in Elwood or Richmond.
And the vendor across the table is still anchored to the peak. Pressure rarely moves an anchor. Evidence does.
So the risk in this market is not missing out. It is paying a peak-era price on thin evidence, or settling for the one property that happened to be listed.
Because owners can choose not to sell. When values soften, most owners anchor to the best price they ever heard for their street and hold off, and buyers wait too, so the only people who transact are the ones who have to. Fewer homes change hands, while the price index looks orderly because it is built from a smaller and less representative sample.
Melbourne sales volumes fell 18.4 per cent in the three months to September 2026 compared with the three months before, close to one in five transactions. Nationally the fall was 17.4 per cent. By the end of September, national home values were down 5.2 per cent from their peak.
Probably, though with a lag. A housing correction shows up in volumes before it shows up in prices. An owner anchored to a peak price can sit out a quarter or two, but fewer can sit out a long stretch of high rates. As more owners move from wanting to sell to needing to sell, prices probably start to catch up with what volumes are already saying. Some forecasters now have the peak-to-trough fall reaching 13 per cent.
Stamp duty is collected on price multiplied by volume, so it falls twice when both drop, and land tax follows more slowly. Victoria's own budget papers estimate that a 10 per cent fall in prices combined with a 10 per cent fall in transactions in 2026-27 would cost the state about $3.4 billion in revenue.
A thin market cuts in two directions. You face fewer competing buyers, but you also have fewer homes to choose from, and the ones that are listed lean toward owners who have to sell. With fewer sales, each comparable carries more weight and goes stale faster. The risk is not missing out. It is paying a peak-era price on thin evidence, or settling for the one property that happened to be listed.
If you are weighing up a specific property or suburb, send me the details and I will give you an independent read on where it sits. Or book an initial review and we can work through your brief.
This article is general market commentary only. It does not take your personal circumstances into account and is not financial or investment advice.
If you’d like to talk it through, we can map out the next steps.
No obligation. Just context.


It all starts with a confidential conversation.



.svg)


.svg)